
Designing Digital Forgetting
2022
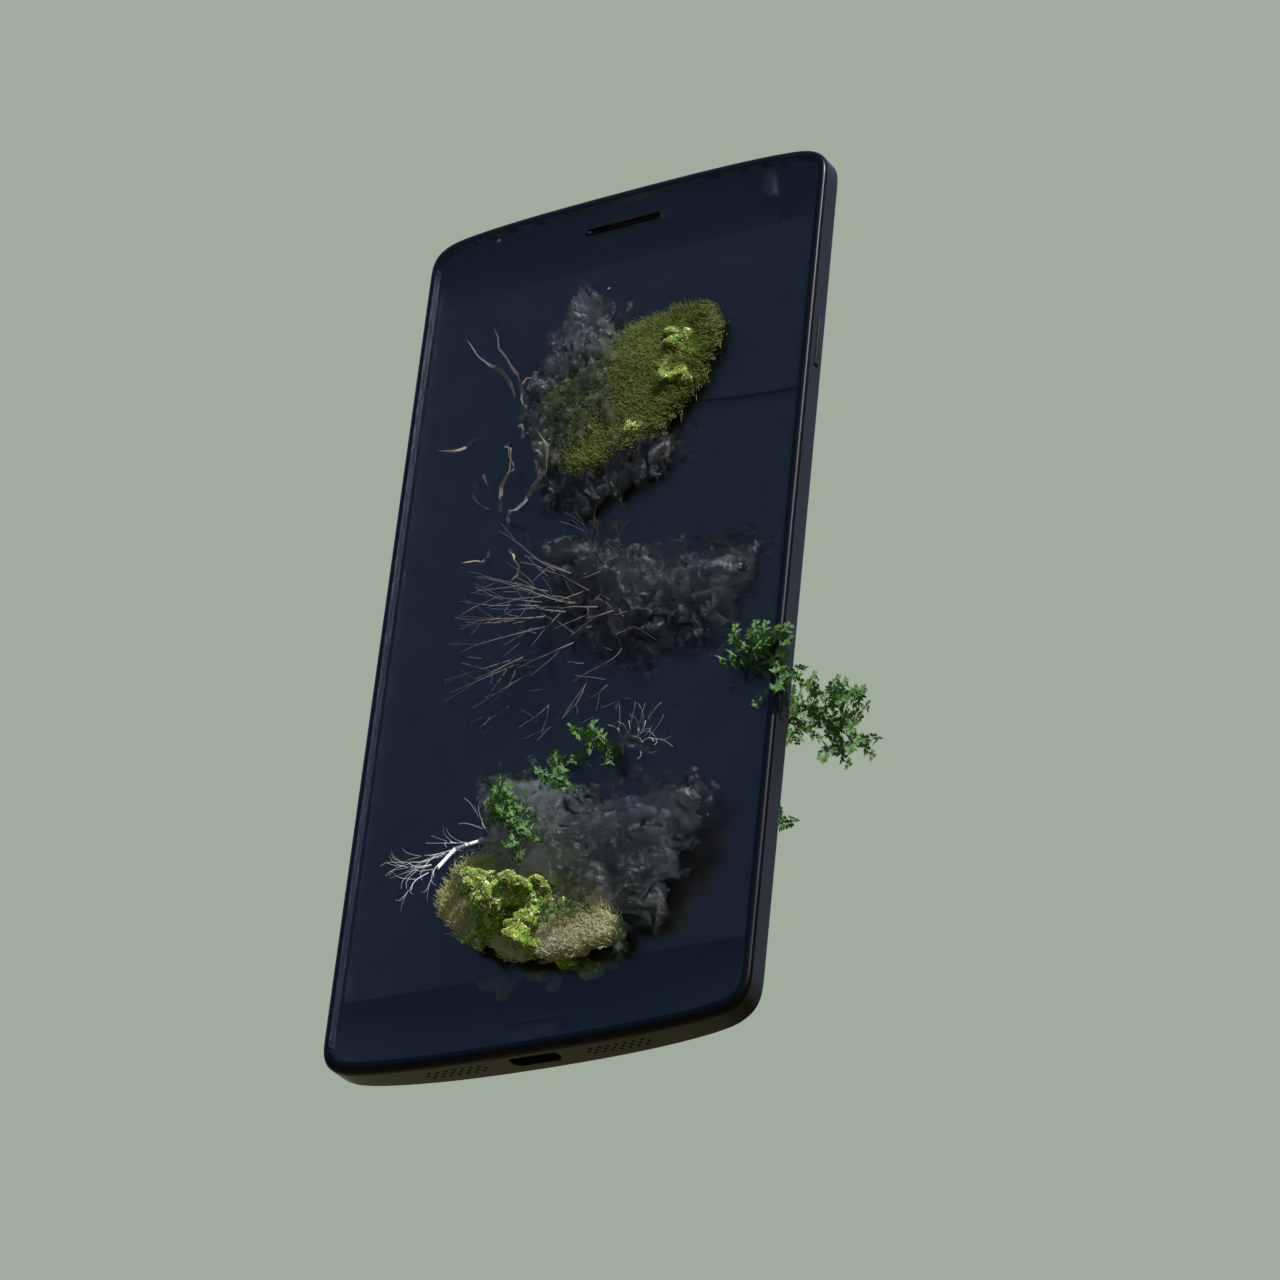
Abstract What if there was a button on your screen next to delete, archive and block that says Decay? What if your digital data decayed over time, as your memories associated with them healed and were forgotten. Would it help you forget unwanted memories? This research proposes decay as a metaphor for digital memory erasure and experiments with several open source technologies and domestically available materials to develop a tool for Intentional digital forgetting
Research Question
How can everyday user have more control over their digital memories?
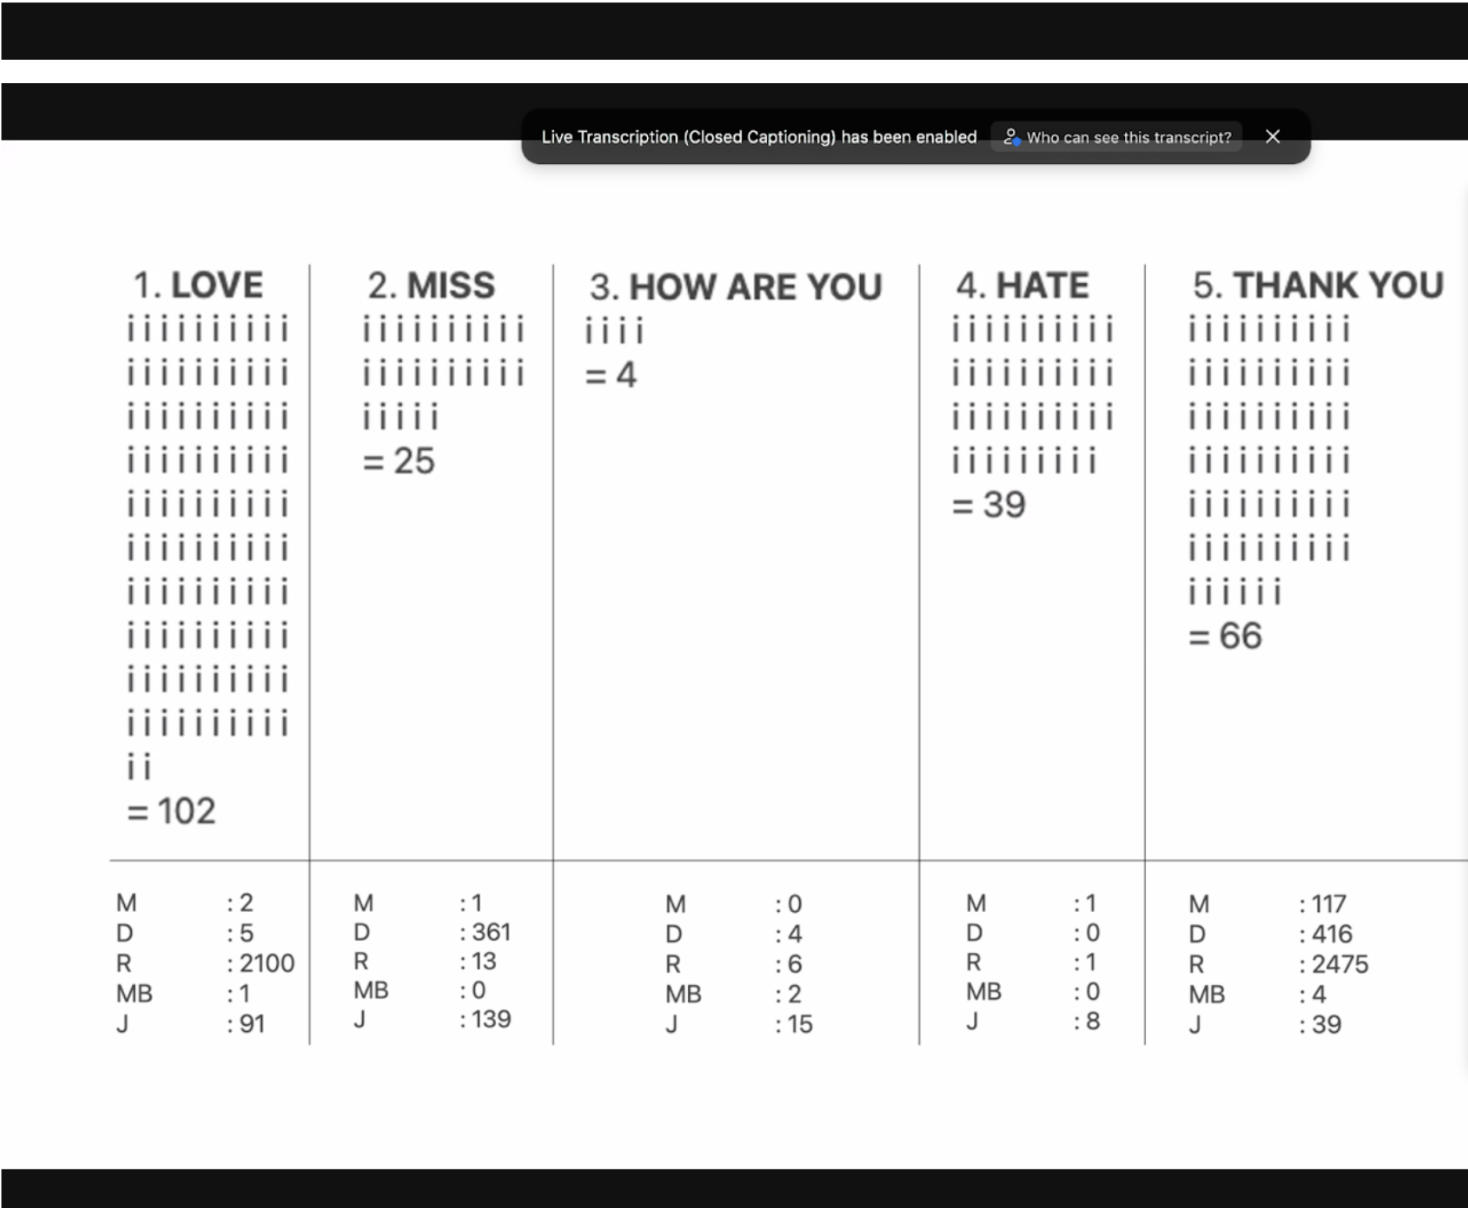
How to develop decay as a metaphor for digital erasure? How to articulate what memory needs to decay?
Outcome
A guide to forgetting which has step by step activities to enable intentional forgetting.
A thesis which explains the context of the work and process.
Screen shot of the Guide to forgetting online
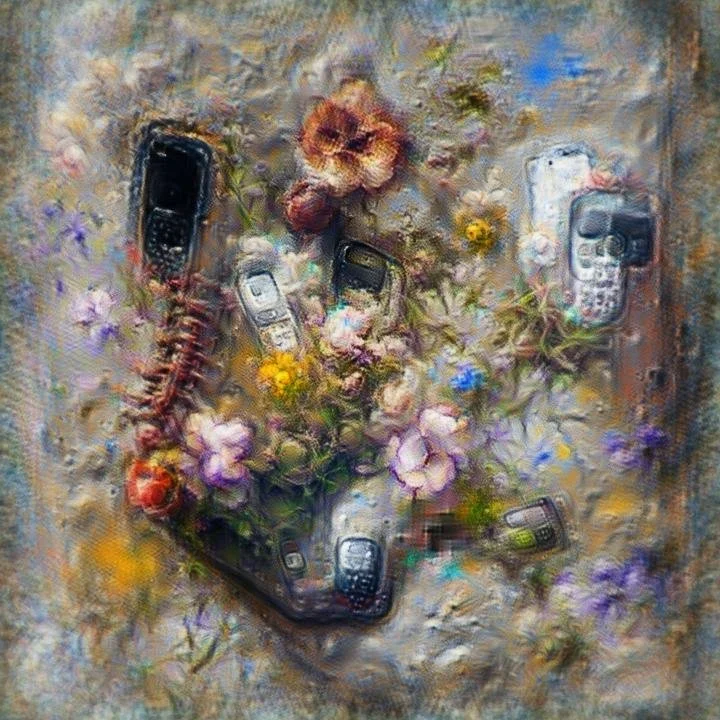
Machine and me, imagining graveyard of memories

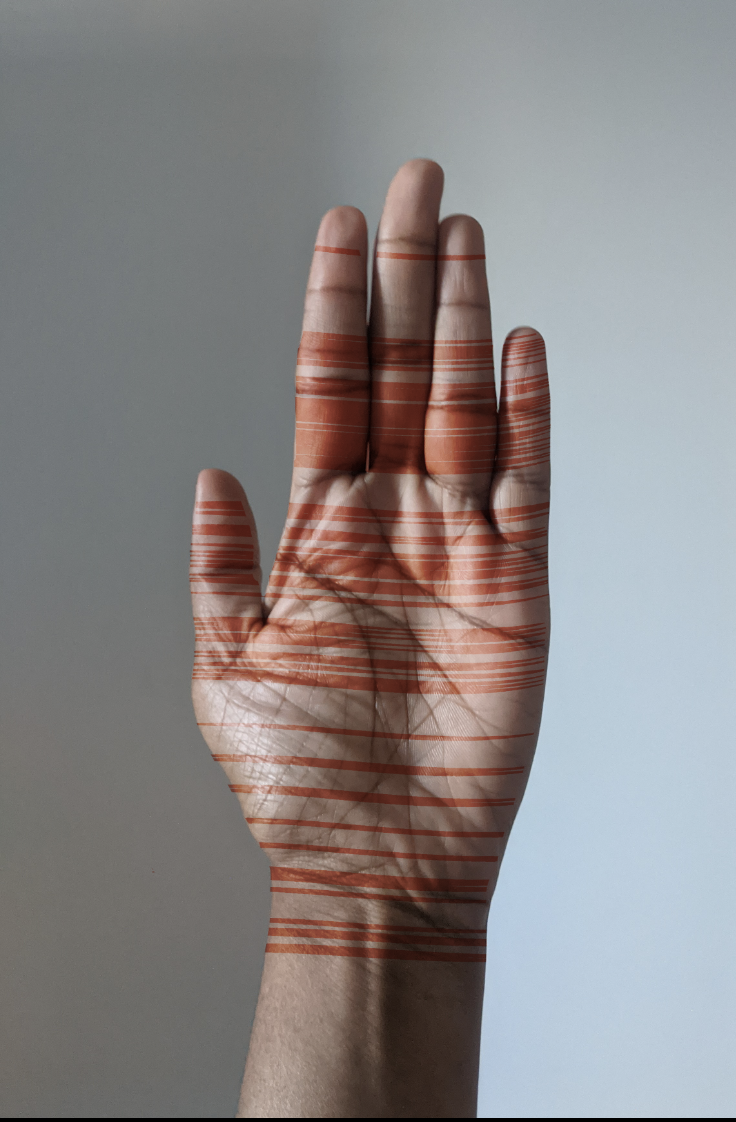
Data Mehndi
2022, Ongoing
Summary
Translation of machine’s permanent record to a decaying human form in a simple, non-expert/accessible form. Has elements of disappearing smell, visual and texture
Research Question
What can human learn about forgetting from what machine recorded
Materials
Google search, Sheets and Mehndi
My Process
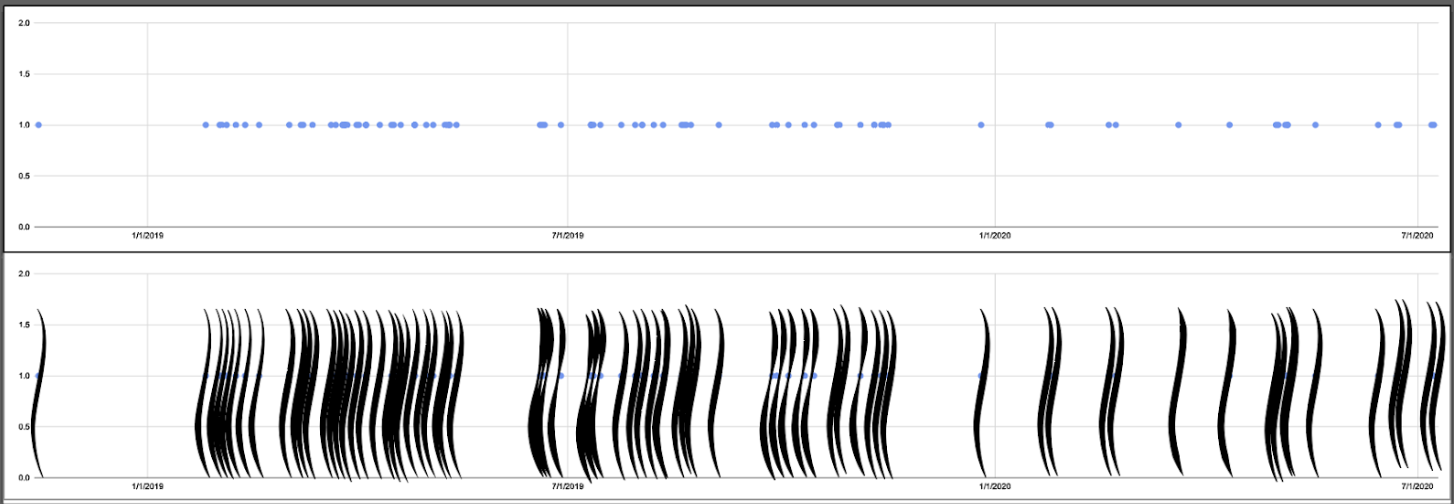
Google searches I made for a US time zone was plotted against dates to visualise a 15 year old friendship growing apart when our timezones changed in 2019. Every time I missed the person, I would make a google search to know if it is an appropriate time to make a call. Over the course of 2 years, the number of searches grow apart( look at the dots that move apart). This was a direct record of how frequently I had a desire to initiate contact.
Future
I am trying for ways to build an interface that will create Mehndi Patterns from your google data as part of my ongoing thesis.

Designing Digital Forgetting
February 2022, Online
Summary
'Break Up Art' workshop is about processing intangible loss through data visualisation techniques.
Research Question
In situations like an encounter with a fuck boy, a missed connection or getting ghosted, how does one get over someone that never happened?
Where
Workshops were run with 15 participants as a part of Across RCA in 2 sessions

Due to Covid restrictions, workshop had to be run online. Google sheet art was used as a way for participants to warm up and start sharing their thoughts in an intimate, yet public way.
Sample of my work shown during the workshop as a way to teach
Participant used photography to tell the story
Participant uses counting as a way to make sense of chats

Participant used google slides gradient to show their romantic past
Some images participants created during the workshop week and how they were shared on google sheets as a playful method to make them comfortable.
My Role
The workshop was designed to explore some personal interventions that help process mildly irritating, socially insignificant heartbreaks that one can’t keep talking about with friends and family. The idea evolved from my ongoing thesis project about digital forgetting and processing grief online. Parameters like proposal write-up, tone of voice were carefully designed to avoid any complex situations I am not equipped to handle (for example Death).
Learning
It was surprising to see the variety of work participants created during the workshop. I also found it interesting how some participants used the techniques to enforce a story that is already in their head and how some participants use it as a tool to explore what story could evolve from their material. Pretty obvious stuff when you think about it, but I loved learning how what I designed evolved into.
Design Research
2016-18, Tata Research & Development Center, Mumbai
Context Designed and conducted primary user research and analysis to identify insights for product development and experimental studies. I explored and interacted with users who were less literate, users with visual impairment, and enterprise users within the organization for various ongoing research studies. Worked within a team, the larger research unit and participants.
Outcome ( Research Papers)
Participatory Design of Vaccination Services with Less-Literate Users. HCI (30) 2017: 301-308
A Critique on Participatory Design in Developmental Context: A Case Study. HCI (11) 2017: 647-658
Coping with Accessibility Challenges for Security - A User Study with Blind Smartphone Users. INTERACT (4) 2017: 3-22
Modeling Less-Literate User's Choices of Smartphone Authentication Modes. INTERACT (4)2017: 496-500
Methods
I did field research using elicitation techniques like Contextual Inquiry, Shadowing and Rapid Ethnography Techniques. I designed and conducted participatory design workshops to collect data which contributed to the ongoing larger research at the lab.
My Role
For this specific research study, I was the principle investigator. Designed, conducted the study and wrote the paper from start to finish under the guidance of my Team Lead. For many other research studies in the organisation I have worked on research coordination, data collection, doing secondary studies, writing etc.

Study of Participatory Design of Vaccination Services with Less-literate Users
The study was part of a larger research to gain insights into vaccination experiences and challenges faced by users of vaccination service at Primary Health Centers, Vaccination Camps and Hospitals and attempt to redesign the whole experience. This particular study used participatory design in an attempt to redesign immunization service and also assessed suitability of Participatory Design approach in developmental context

Conducting the workshops in participant’s home
User group
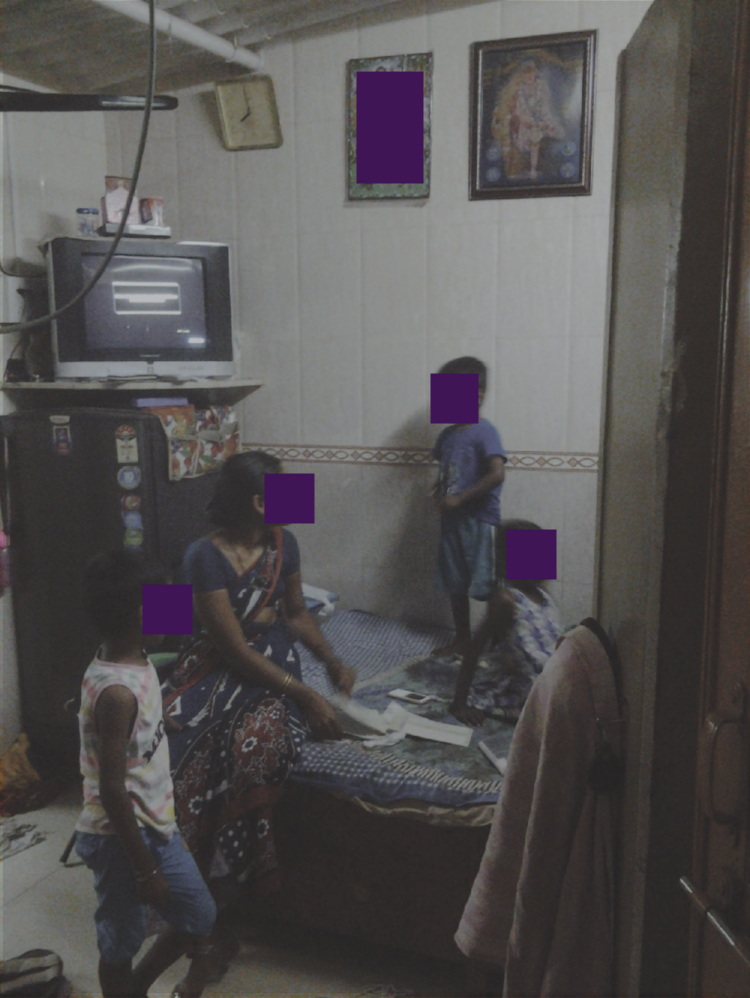
Less literate, young mothers who were immigrant to the city, living in the urban slums of Mumbai

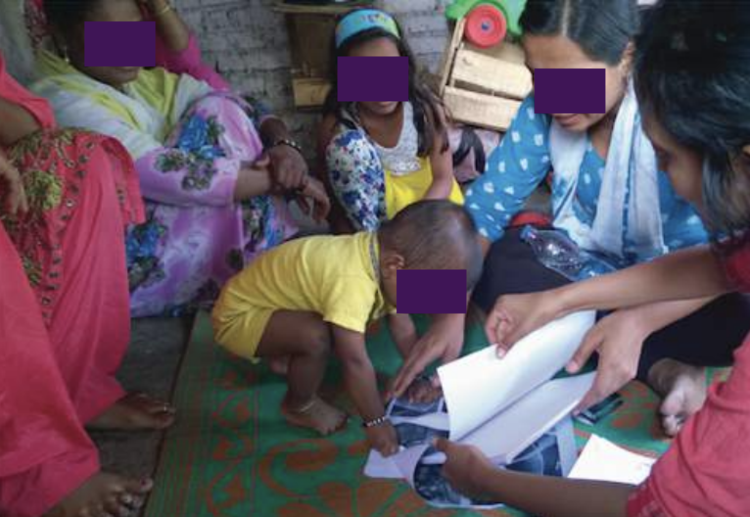
Most homes had a constraint of space and our PD sessions were held amidst blaring television noise, user preparing lunch, kids(like the one on the right), houseguests and family members interrupting us!
Process
Interviews were used for retrospective elicitation of experiences and
challenges. We co-created Customer Journey Maps and stakeholder maps with users. We purchased all the necessary artefacts from the users neighbourhood to ensure things were commonplace to the user. Sanders frameworks of Priming, Probing, Making(to record experiences), Telling and Enacting (role-play and acting) were used


KEY FINDINGS
Contribution to knowledge
Applicability and Adaptation/critique of PD
Applicability of PD techniques
Factors affecting PD (breakdowns)
Preparing users, Engaging users,
Breaking power distance
Family hierarchy power structures
Enabling creativity
Communication barriers
PD outcomes
Design ideas for service alternatives
Elicitation of issues and challenges faced, mis-information

Team members : Sylvan Lobo, Pankaj Doke, Ulemba Hirom, Sujit Devkar
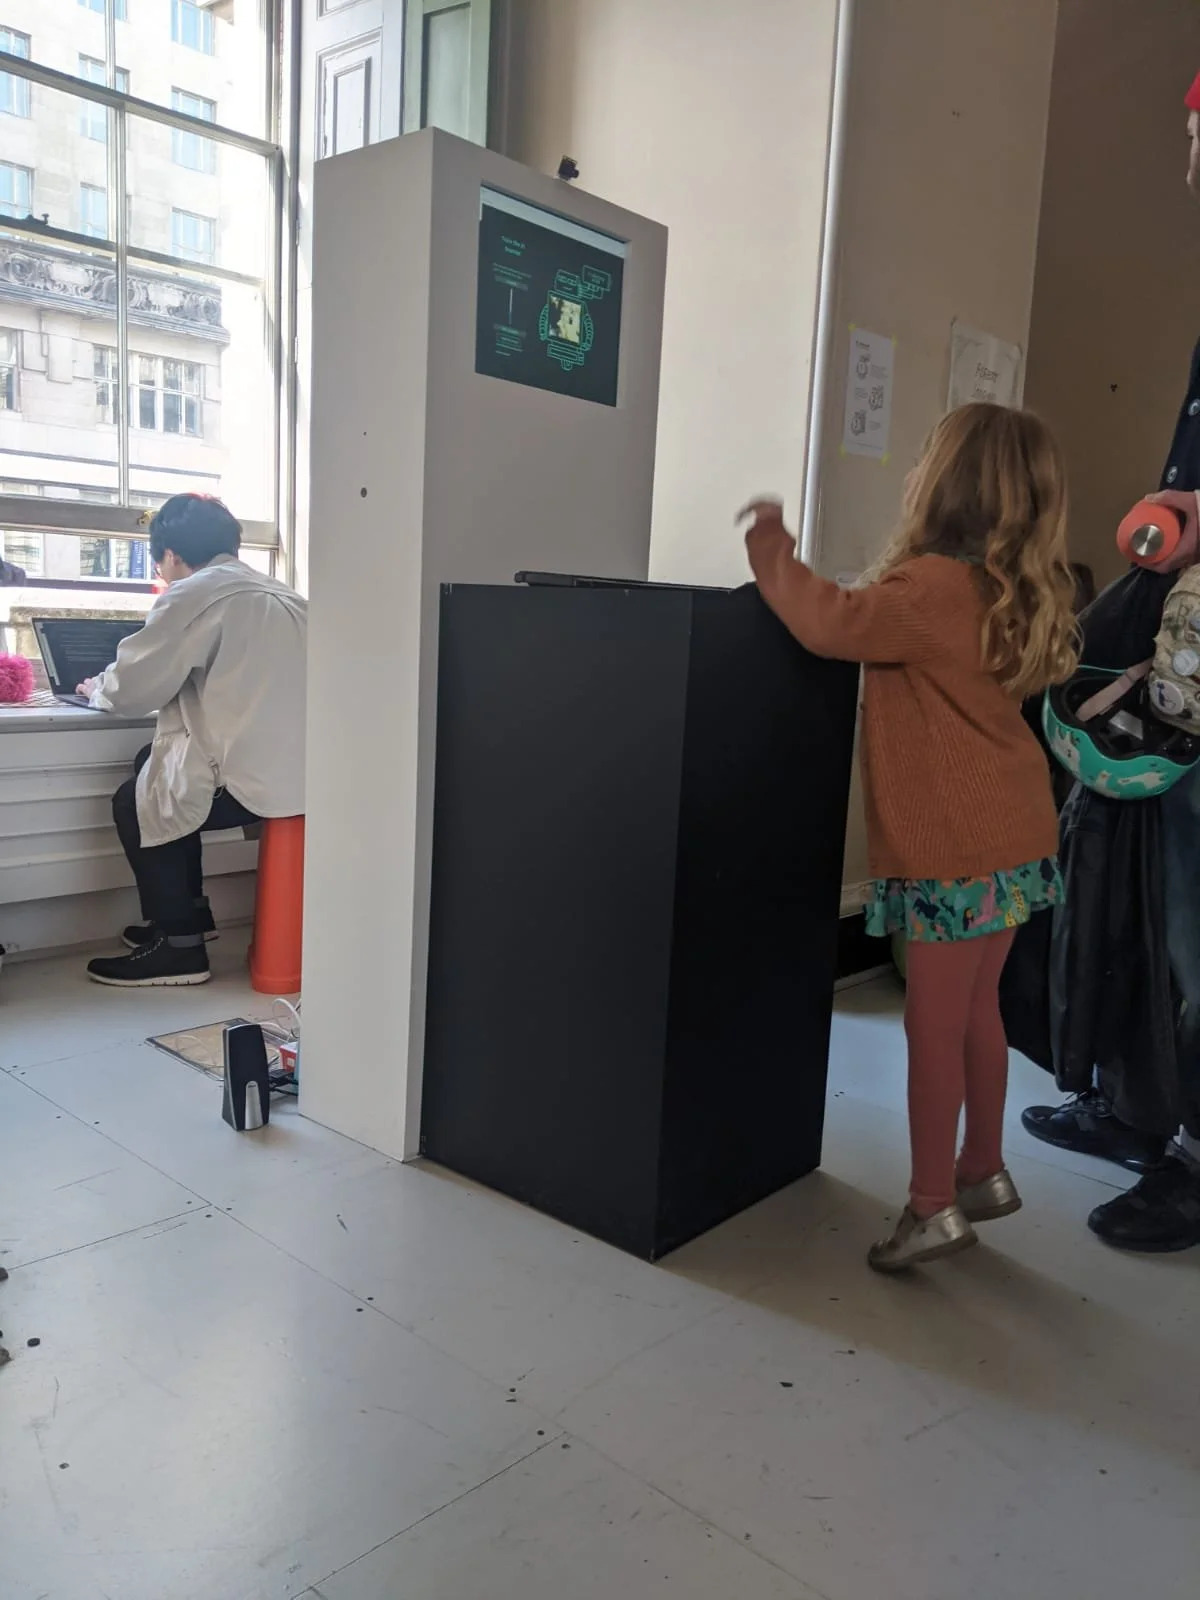
AI Bouncer
April 2022, Somerset House
Summary
AI bouncer is an interactive game that allows anyone to train an AI and understand the consequences of having an automated decision making system that inherits human biases.
What does it feel like when the AI lets you in? And what about when it doesn’t?
Who
Created during a 10 day design camp at Now Play This festival with Tomo Kihara and Lale Walker. It was open to public for 3 days in April during the festival

Stage 1

Stage 2
A kid playing with AI bouncer at the festival
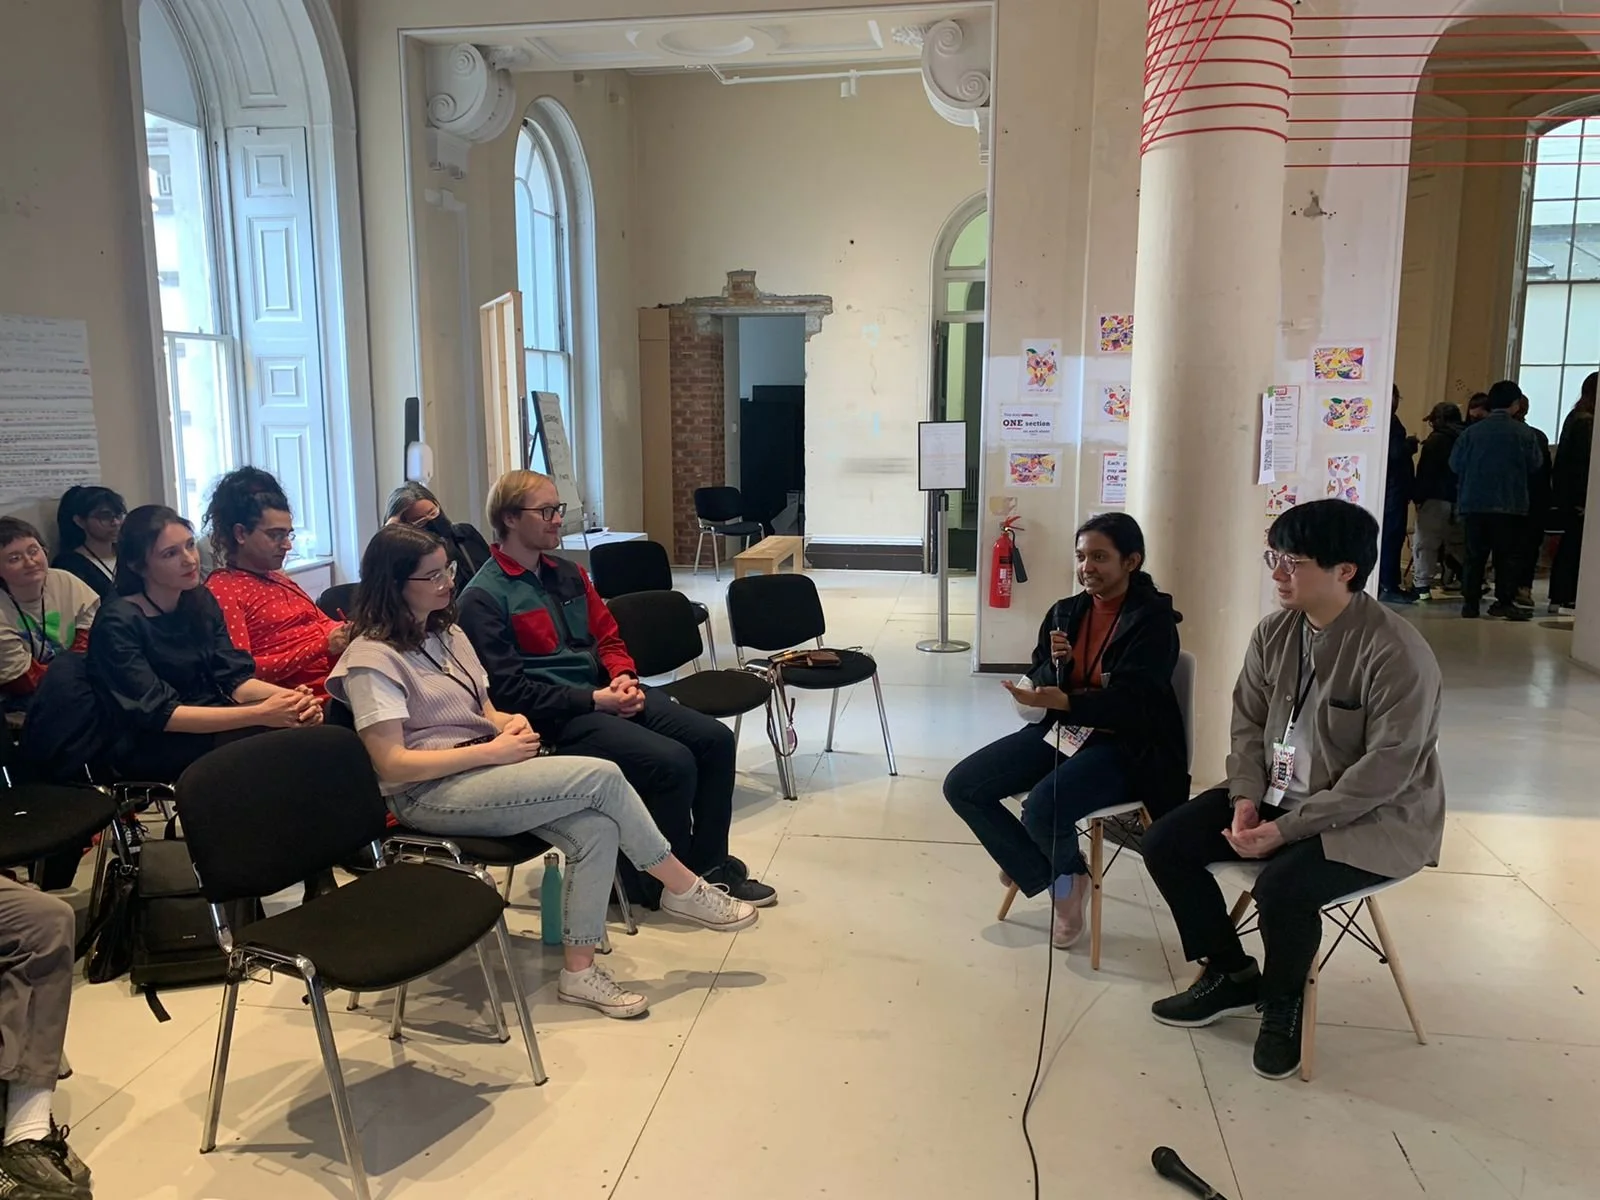
Tomo and I, presenting our work at Now Play This festival
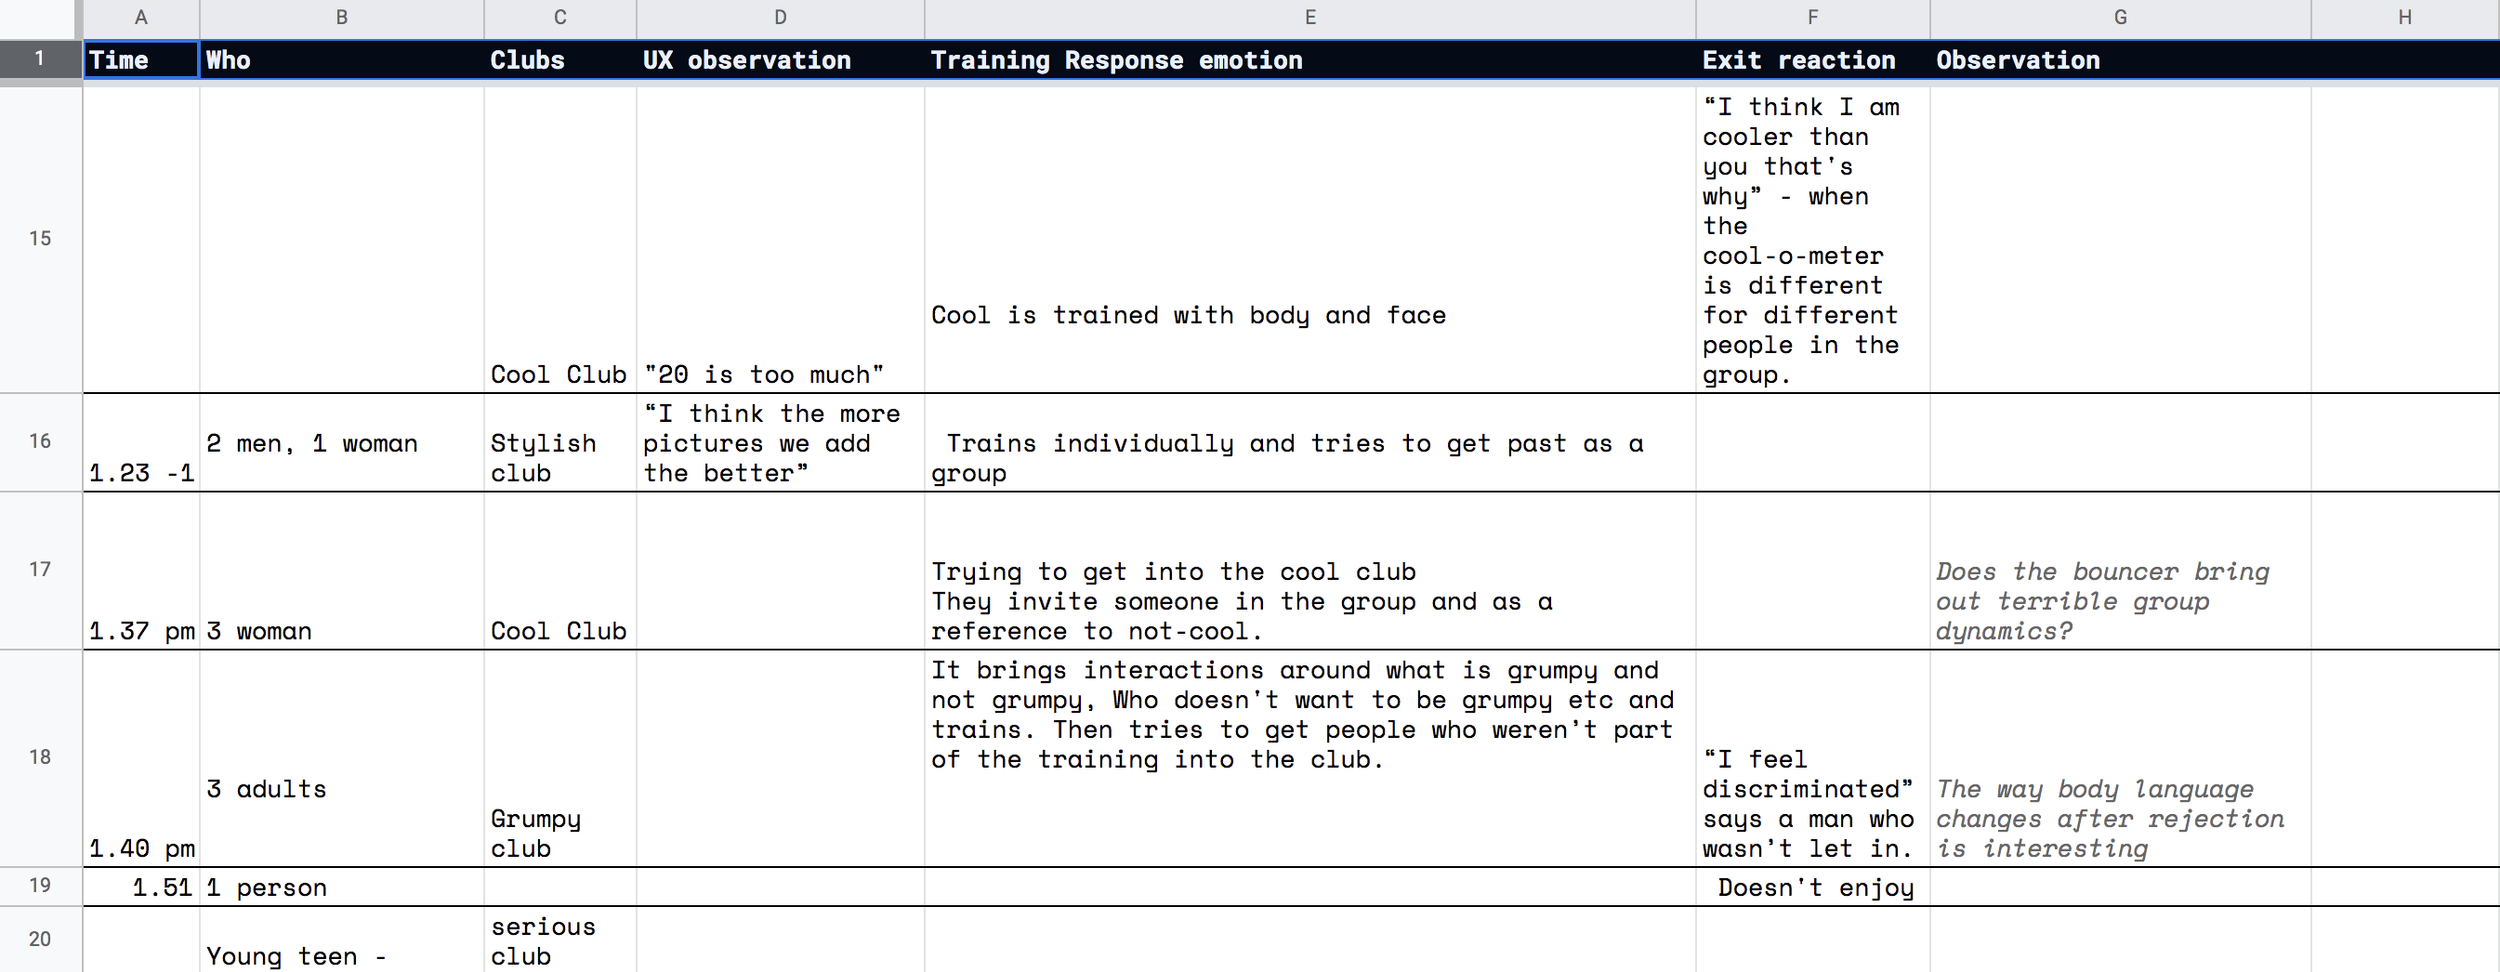
Above observations: During the exhibition, I noted down my observations of how people were interacting with the game to constantly iterate and improve the game.
My Role
I worked on the front end, interaction, visual assets. I also did play-testing, user research and writing.
Extract from Observations
..People trying to interpret the club they didn't make is interesting. It brings more laughter. People ask questions of ‘what does –happy- look like, How to show Grumpy, silly etc…

Road ahead
March 2022
Brief
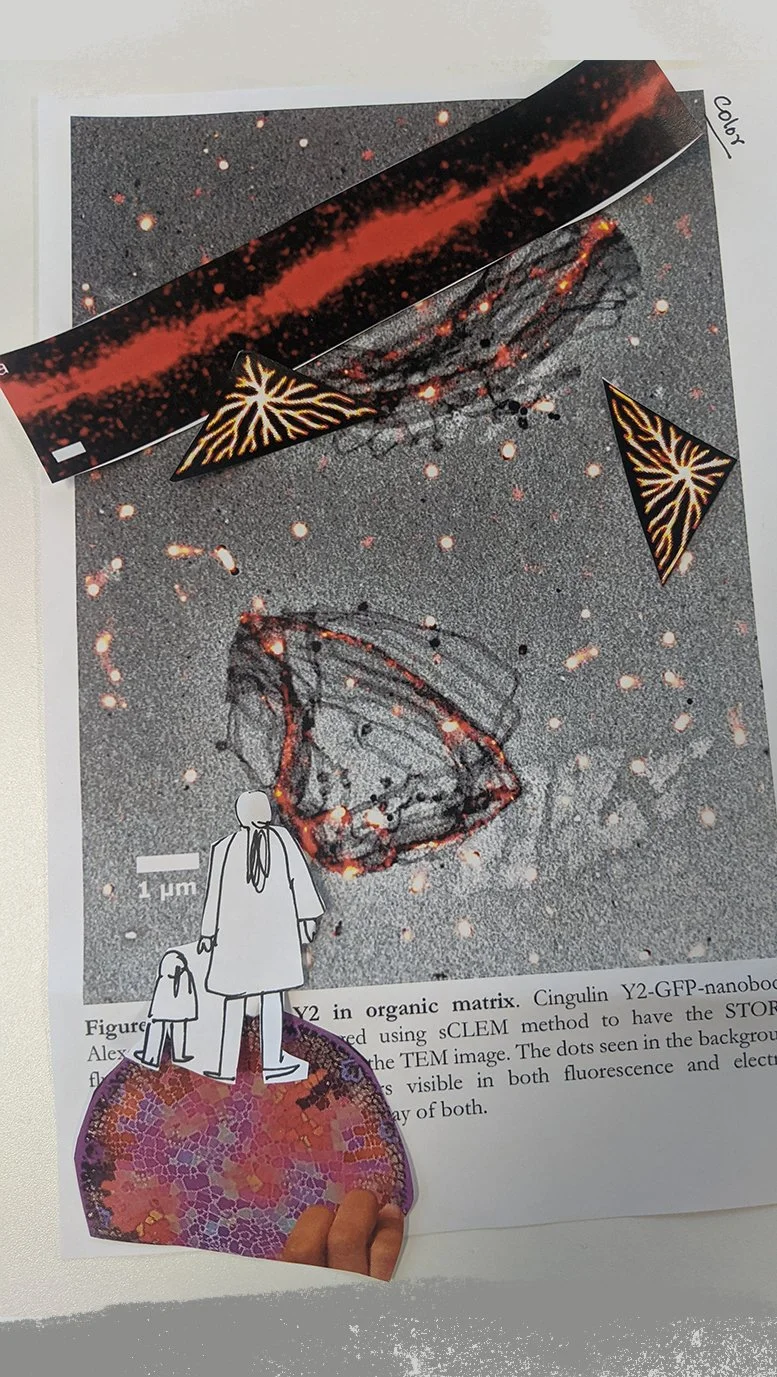
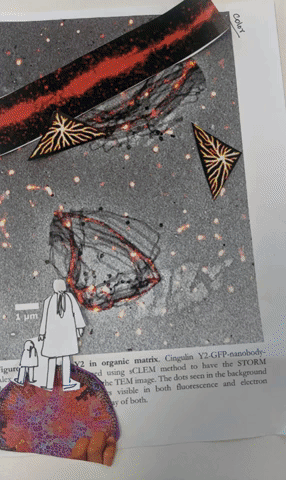
Commissioned as a postpartum gift this illustration maps the scientific research of a Biophysics doctoral researcher. I was asked to create a tangible reminder of her passion and achievement as a scientist as she learned about her life as a new mother.
Process
I used images from her current research work to build the ground where she stands and her future research path to build the forest ahead. I incorporated the patterns from her scientific research into several easter eggs throughout the drawing, including their clothes.
Learning
I had a lot of fun trying to work from images I have never seen before, of a world our eyes can't see of diatoms, electron microscopy, and biophysics.

Initial Sketch
Process

References
Process
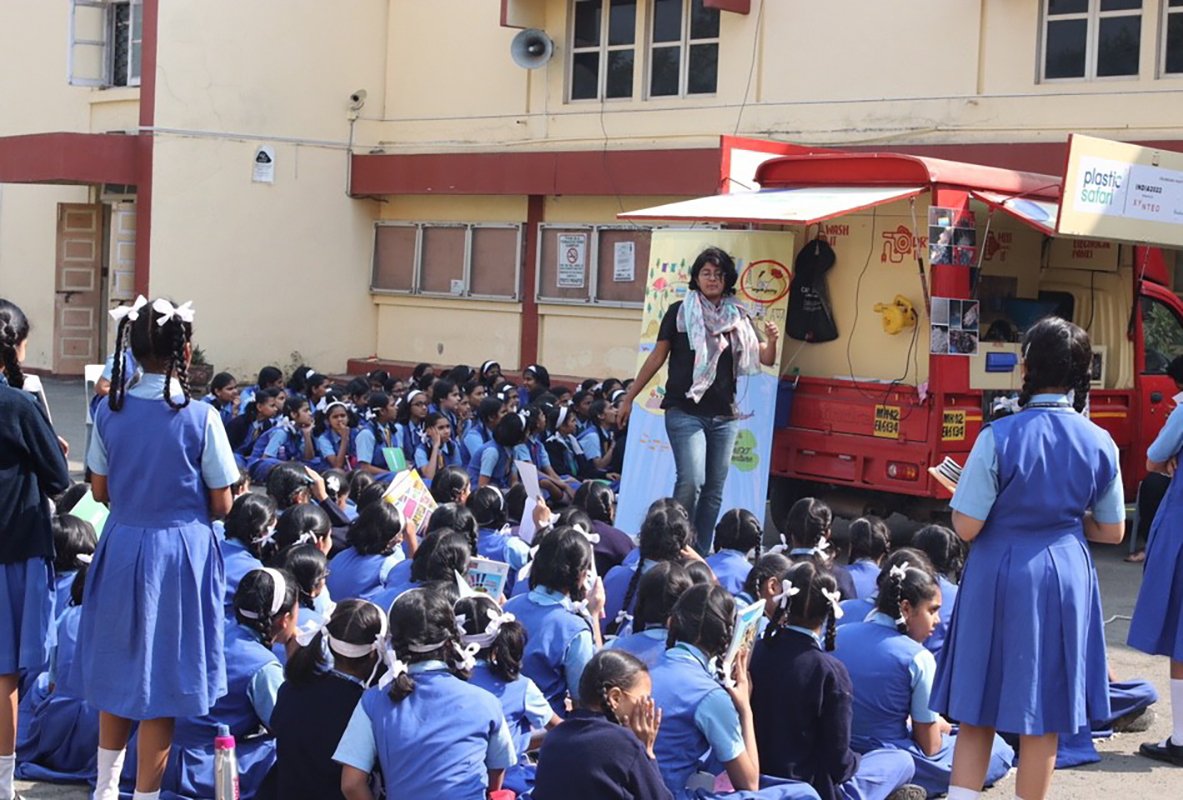
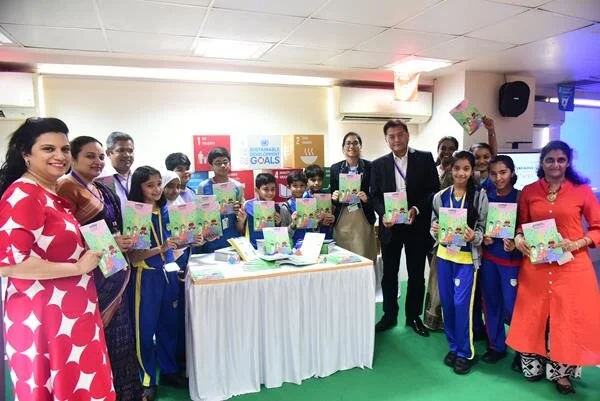
Plastic Safari
Client : Xynteo
Category : illustration. book. kids
Year : 2019
Plastic Safari is an end-to-end waste management programme being run in schools and housing societies in Dahisar from November 2018 to January 2019. Through Plastic Safari, Mumbai city residents will learn more about different kinds of plastics, understand the urgent need for segregation and know the value of plastic waste. This will encourage them to be more responsible consumers.
My brief was to collaborate for developing the interactive curriculum and design an activity book meant to teach school kids about end-to-end waste management.


Characters
Rani loves a good adventure, so you’ll always find her with her backpack on her back ready for the next adventure. If you can’t find her sometimes then she is probably up to some mischief.
Plasto: Don’t get fooled by its size. This bright coloured being may be small but is the leader of the Plastic Safari troop. It is passionate and fun-loving and loves storytelling! It is super strong, can shapeshift into any form and can survive in water too.
Raj is the brains of the Plastic Safari troop and a loyal friend you’d like to have by your side. He is a science whiz whose magnifying glass is never too far away and who spends a lot of time trying to understand how the world works!


Designed a 2 part habit tracker activity for kids to help them keep track of waste recycling. Over a period of 21 days, the above sticker - puzzle is completed by kids to reveal the message.


DATA STORIES
Client : Self Initiated
Category : data visualisation. healthcare. Communication
Year : 2019
Kerala, one of the most densely populated states of India, experienced a terrifying outbreak of Nipah virus infection in May 2018. In Kozhikode, a northern district where the epidemic spread, every aspect of public life was affected. The issue affected the community as well as the government systems. Kozhikode city virtually came to a grinding halt. People refused to venture out of their homes. For about two weeks Kozhikode was a ghost city.
The following data visualisations were commissioned by Department of Health, Kerala regarding the Nipah outbreak. They were then part of a solo exhibition titled Luck, death & Data, which was about the 48 day period of the Nipah outbreak, how the department of health tackled it, the emotional experience of the public & my personal experience.

data STORY 1
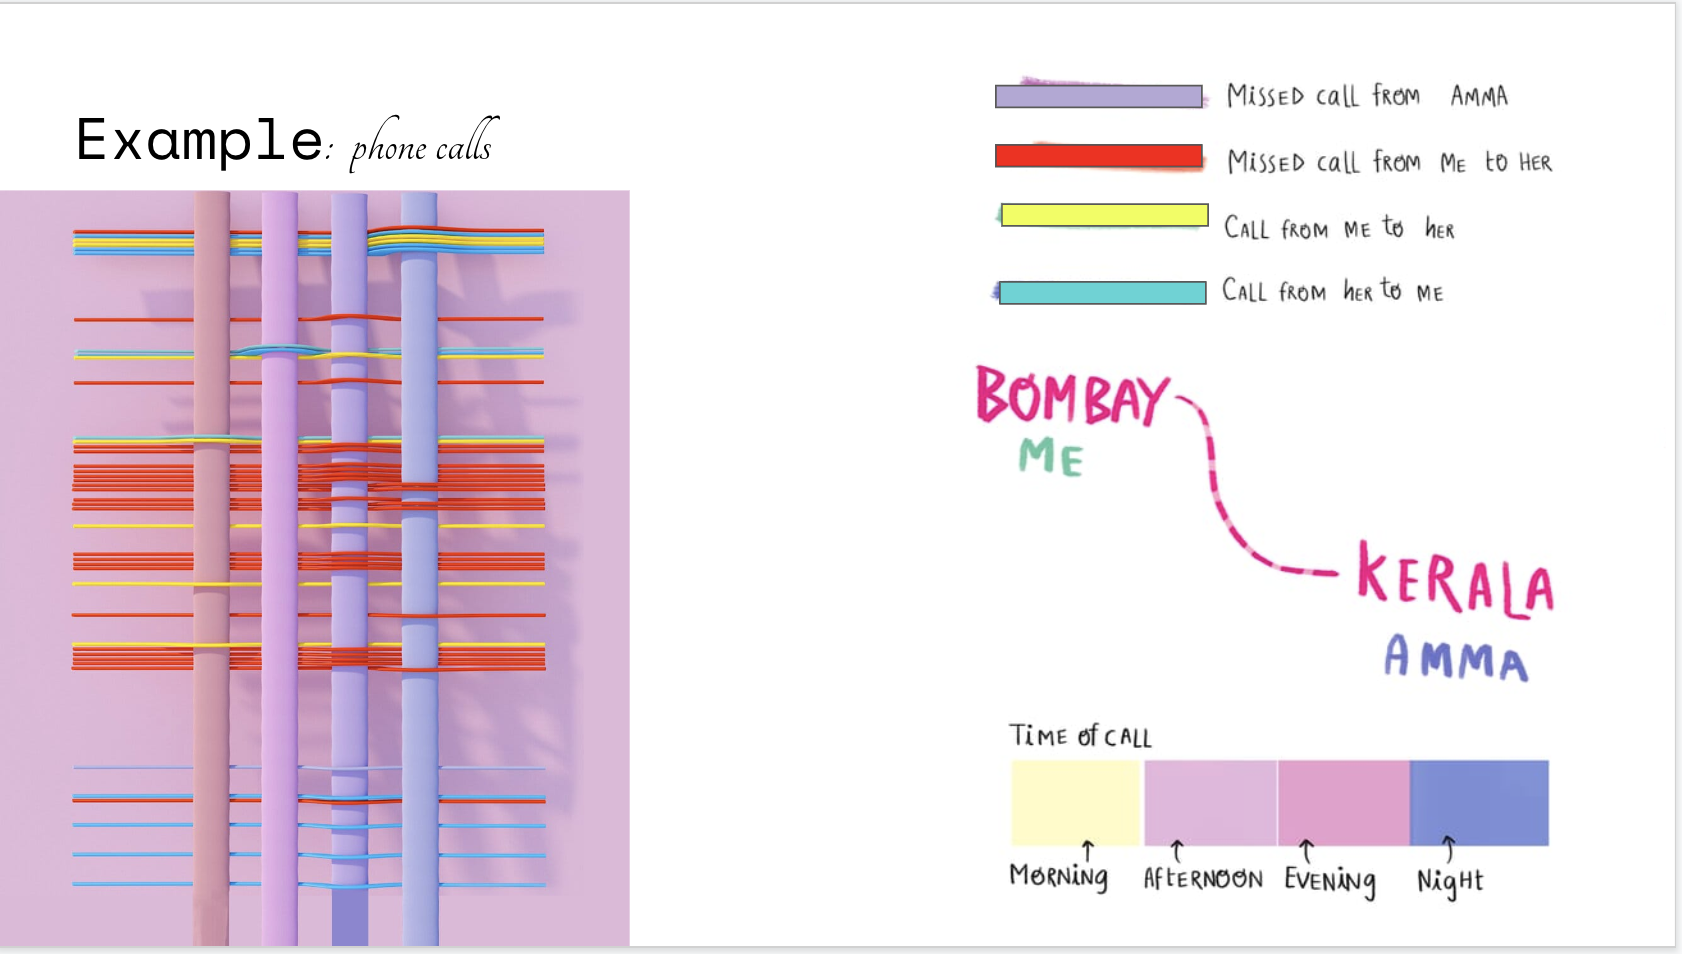
In 2018 May, my home town, Calicut, was hit by a virus that had no treatment protocol and high fatality rate. It was a terrifying experience where I was scared for my loved ones and my family who were health workers on the field. This is a visualisation of the phone calls between my mother and I during the period of Nipah . We were separated by a distance of roughly 1,194 kms. Most of the calls were for 30 seconds and it was just a way for me to make sure, she was still not affected by the virus or nothing had happened to her.

PROCESS

FINAL IMAGE

This is the kind of mask I wore back then to breath again. It is one of routine & goals. I was tracking my daily life & I gave myself ‘stars’ for every minor achievement like getting up on time, working, moving, cooking. What masks do you wear?

data STORY 3
This is a visualisation of the 48 day period of NIPAH virus spread in Kerala and how the department of health, Kerala tackled it. DAY 1 is on the left, marked with a long purple pathway.


Design for Epidemic- Nipah
Client: Self initiated
Category: Exhibition. Illustration. NIPAH
Year : 2019
In 2018 May, my home town, Calicut, was hit by a virus that had no treatment protocol and high fatality rate. It was a terrifying experience where I was scared for my loved ones and my family who were health workers on the field. Luck, death and data is a design exhibition I created in response to the incident, about my personal experiences, collected stories about the Nipah Virus attack and collected data from journals and health workers during a 48 day period of the Nipah virus attack in Calicut, Kerala in 2018. The exhibition was held in Calicut and through it I was trying to find how a community survived days of what seemed like death sentence and how they found resilience.

At the very beginning of the incident, I wasn’t sure about what was happening or how severe is it. I was praying selfishly for my loved ones.


